Does my data leave my machine?
Never. BurnRate runs entirely on your local machine. Your code, session data, and analytics are computed locally. The only network call is license key validation (Pro/Team), which sends zero usage data.
What is subagent observability?
When Claude Code runs complex tasks, it spawns subagents — child processes that each consume tokens independently. BurnRate parses your local JSONL session data and builds a tree view of every agent and subagent: what tools each one called, how many tokens it used, how long it ran, and what it cost. No SDK, no proxy, no config — it just works. Anthropic closed community feature requests for this (#10164, #10388), so BurnRate is currently the only way to get per-subagent cost breakdowns.
Which AI tools are supported?
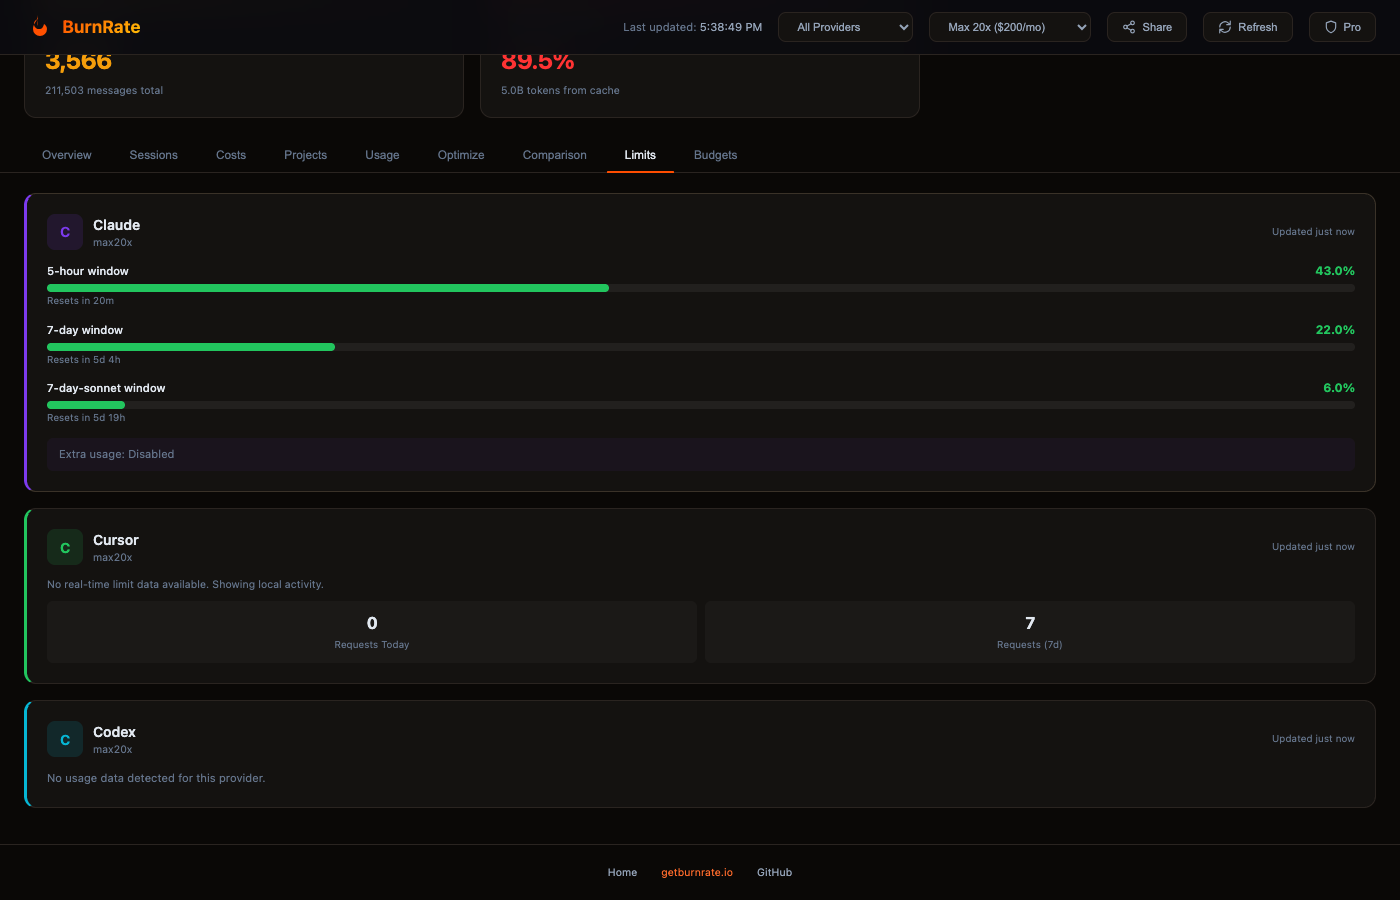
Seven providers: Claude Code, Cursor IDE, OpenAI Codex, GitHub Copilot, Windsurf, Cline, and Aider. The plugin architecture makes it easy to add new providers as they emerge.
How does licensing work?
Free tier works without any account. Pro and Team plans use a license key that you enter once. The key validates online every 24 hours with a 7-day offline grace period, so it works on planes and in secure environments.
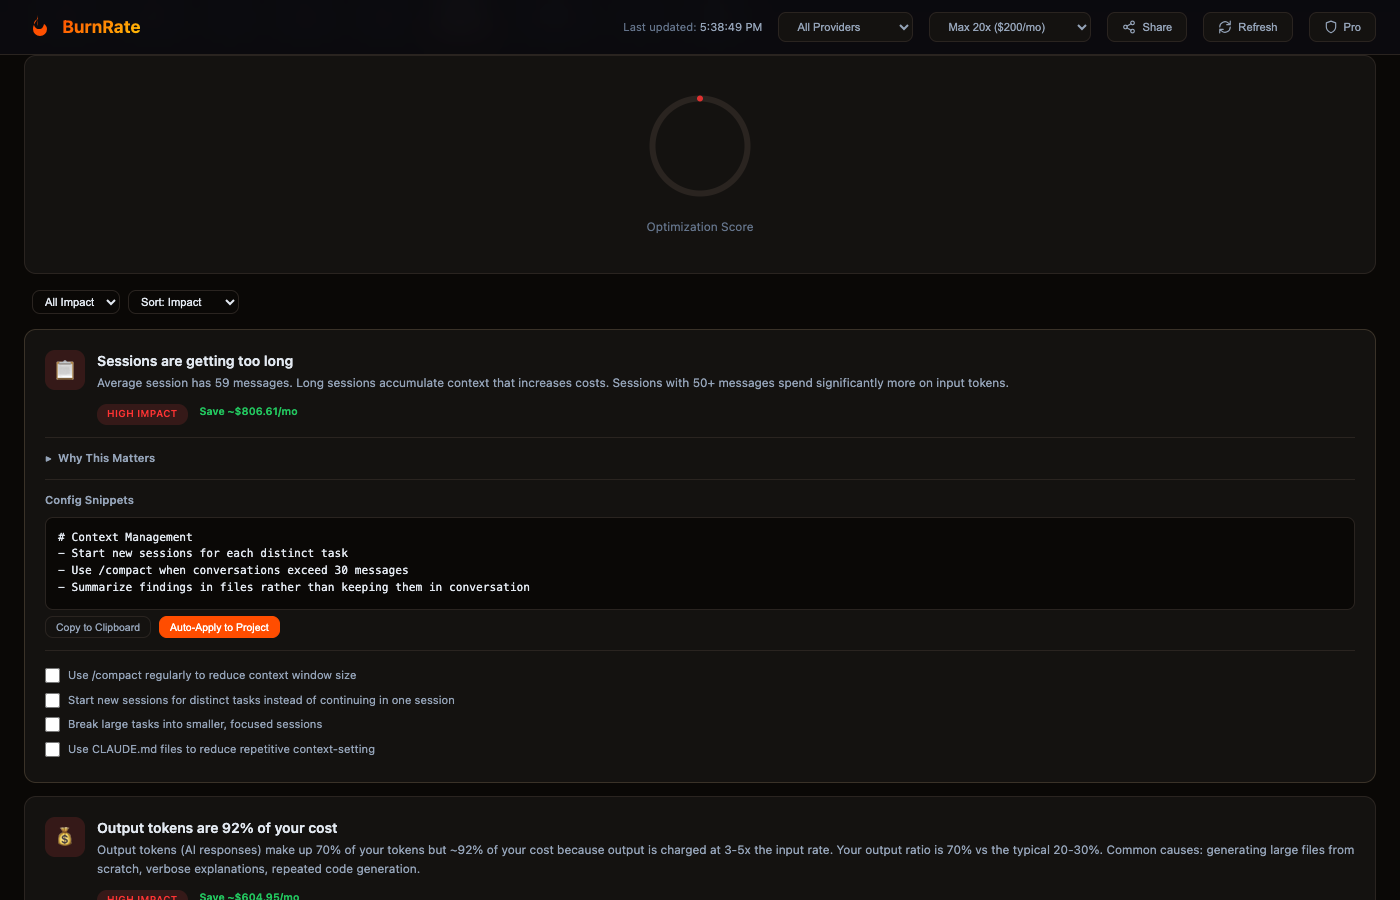
What does the optimization engine do?
It analyzes your usage patterns across 46 dimensions: output-heavy sessions, context accumulation, session depth, operation costs, duplicate work, cache efficiency, provider arbitrage, budget overruns, and more. Each recommendation includes plain-English explanations, real-world analogies, and specific savings estimates based on your actual usage.
Can I use this at work?
Yes. Since no data leaves your machine, there are no compliance concerns. Team plans add shared dashboards so your engineering team can track AI tool ROI.
What if I cancel Pro?
You keep the Free tier features forever. Your local data is never affected. You just lose access to the advanced analytics tabs and optimization engine.
How does team analytics work?
Each developer installs the BurnRate binary on their machine. It analyzes their local AI session data and pushes only aggregated cost metrics (no code, no session content) to your team dashboard. Admins see per-developer and per-project spending without ever accessing raw data.
Is this SOC 2 compliant?
Our architecture is SOC 2 ready by design. User code and session data are processed locally and never transmitted. The cloud component only handles authentication, billing, and aggregated cost metrics. We're pursuing formal SOC 2 Type II certification.
Do you offer volume discounts?
Yes. Teams of 50+ seats qualify for custom Enterprise pricing with volume discounts, dedicated support, and custom integrations. Contact
matt@getburnrate.io.